Featured Projects
Analysis on Yellavates
- Microsoft Excel
- PostgreSQL
- Pivot Table
- Data Cleaning
- Exploratory Data Analysis
- Data Visualization
- Course Project
- Group Project
This is the 1st group project from an online course in data analysis. This course project makes use of the learning of SQL and Excel. The Project has task us to find the reasons for why Yellevate losses its annual revenue to disputes.
Check it out
Analysis on Attendance using Clockster
- PostgreSQL
- Power Bi
- M Query
- Dax Analysis
- Dashboard Creation
- Data Modeling using Schema Diagram
- Data Cleaning
- Exploratory Data Analysis
- Data Visualization
- Course Project
- Group Project
This is the 2nd project from an online course in data analysis. This project makes use of the learnings in Power Bi. A medical Company has tasks us to investigate the attendance of their employees if they follow the schedule or not.
Check it out
Analysis on Open Restaurants in Open NYC
- PostgreSQL
- Power Bi
- M Query
- Dax Analysis
- Dashboard Creation
- Data Cleaning
- Exploratory Data Analysis
- Data Visualization
- Test Project
This Project is a test project from one of my applications. This project generates the insights to help in applying for the open restaurant program NYC.
Check it out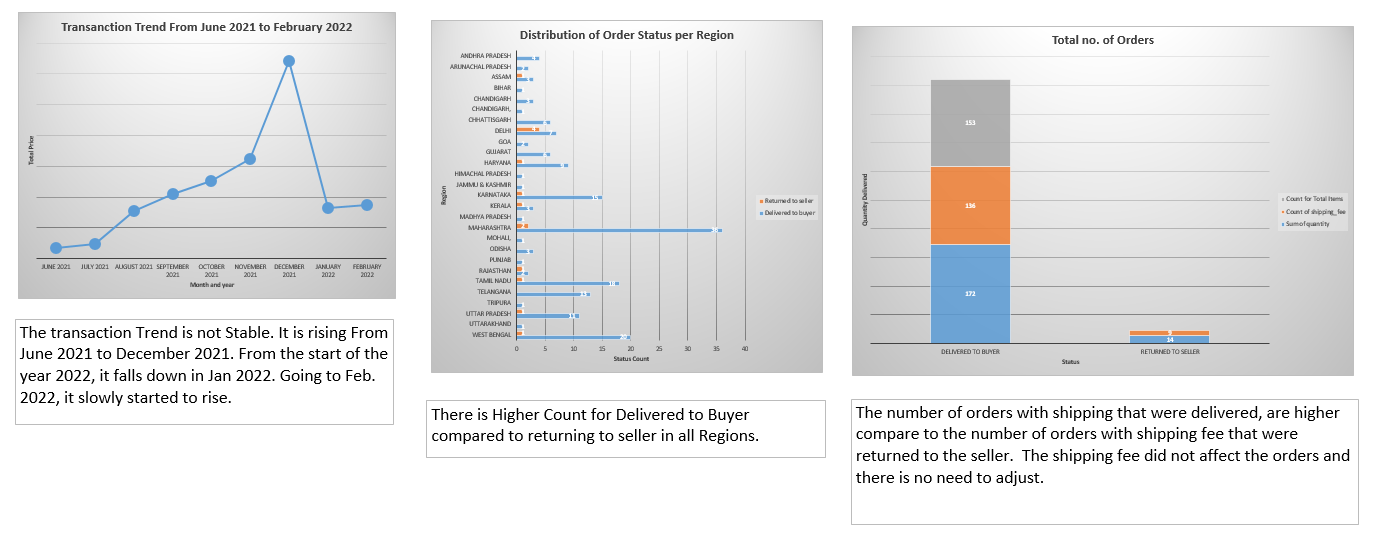
Simple Analysis on deliveries in an logistic companies
- Excel
- Pivot Table
- Data Cleaning
- Exploratory Data Analysis
- Data Visualization
- Course Project
- Solo Project
This is a simple project to display my knowledge on Excel. Data Cleaning and exploration and visualization are all done in Excel.
Check it out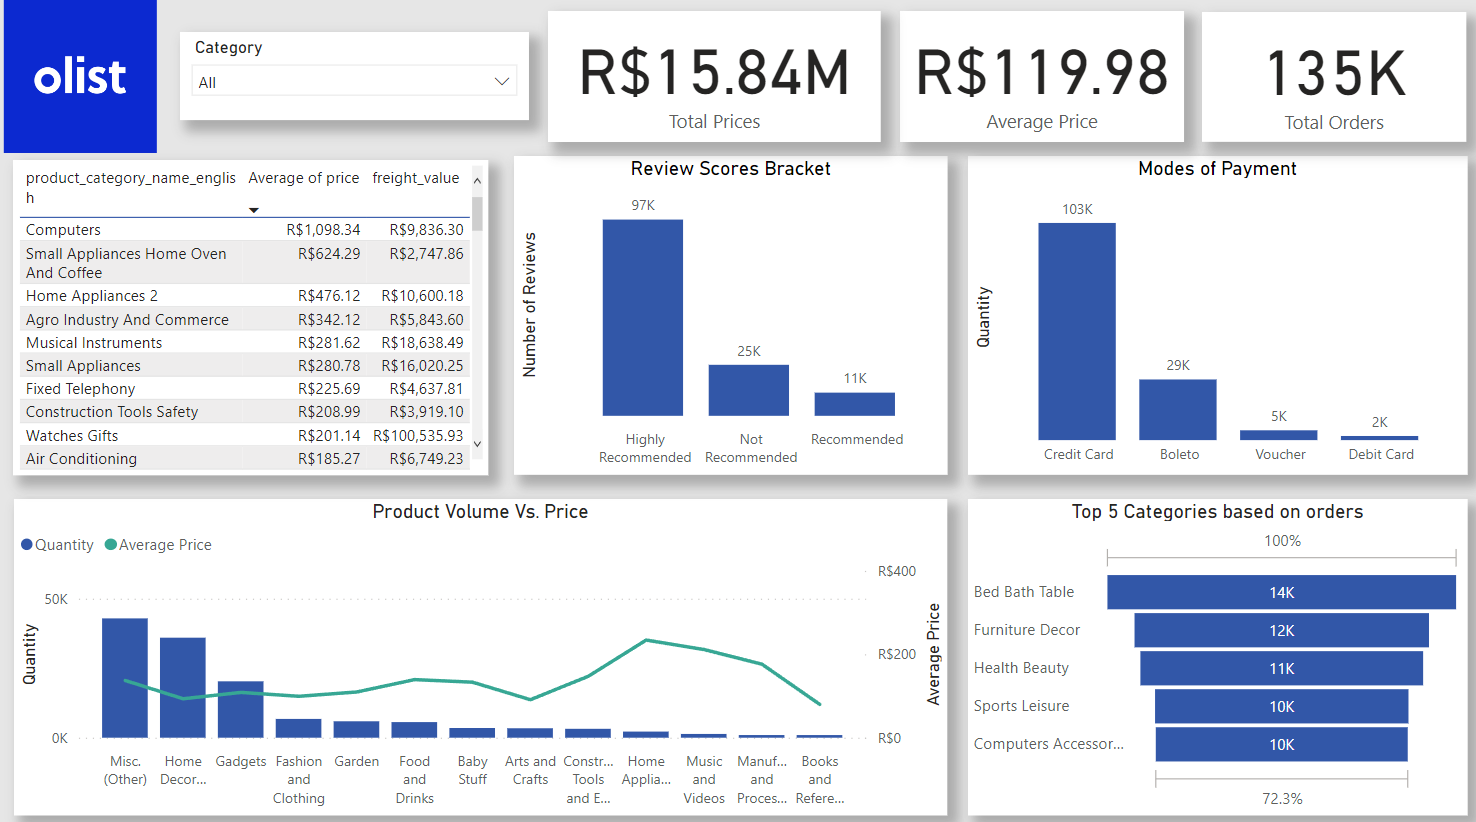
Analysis on Olist
- Power Bi
- M Query
- Dax Analysis
- Dashboard Creation
- Data Modeling using Schema Diagram
- Data Cleaning
- Exploratory Data Analysis
- Data Visualization
- Solo Project
This project portrays my skill in data modeling using schema diagram in Power BI. The project contains 9 datasets for generating insights and visualization and make recommendations based on the findings. The project helps in finding out the trends of orders and finding which categories our mostly order.
Check it out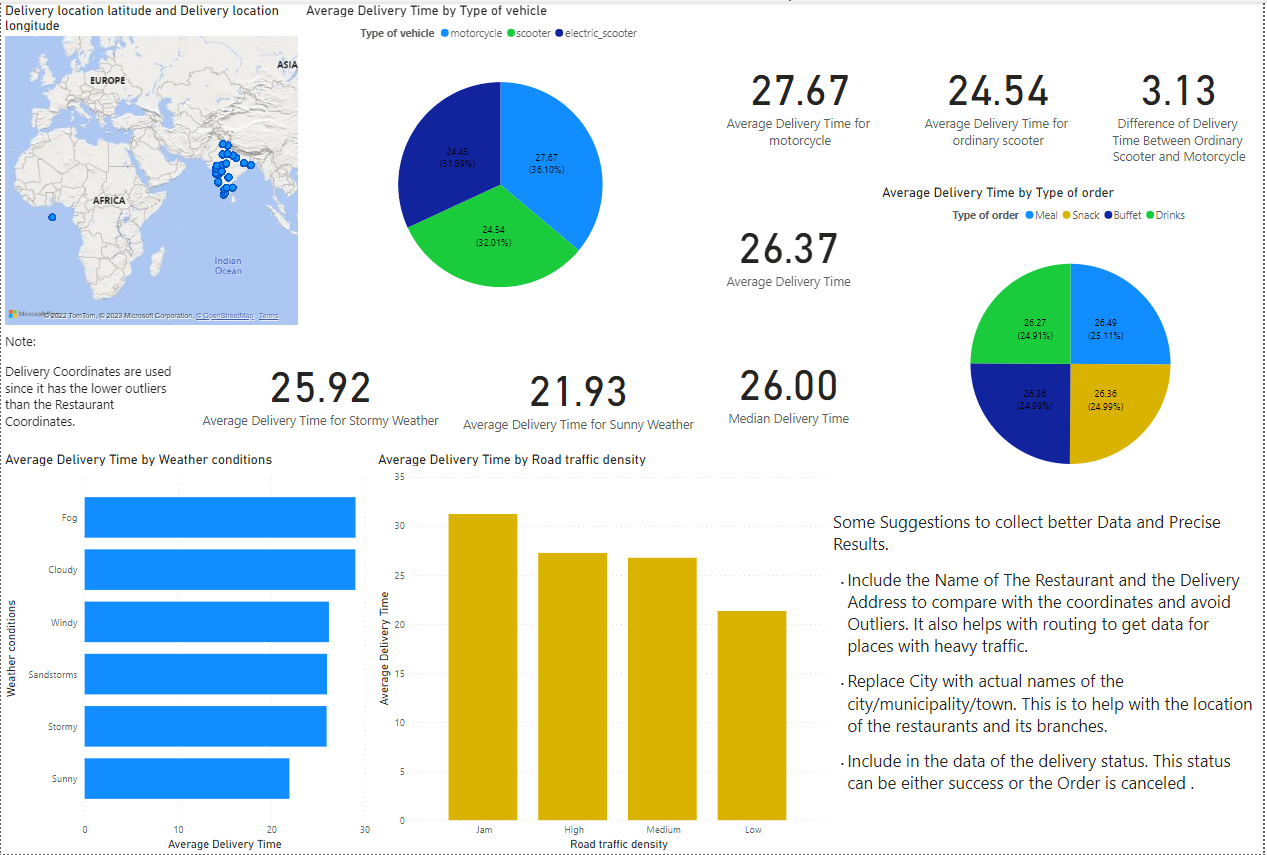
Analysis on Logistics in India
- Power Bi
- M Query
- Dax Analysis
- Dashboard Creation
- Data Cleaning
- Exploratory Data Analysis
- Data Visualization
- Solo Project
This project portrays my knowledge on Power Bi. The skills showcase is Dax Analysis and M query. The project aims to know the deliveries in India, including the weather conditions, delivery time, traffic and locations.
Check it out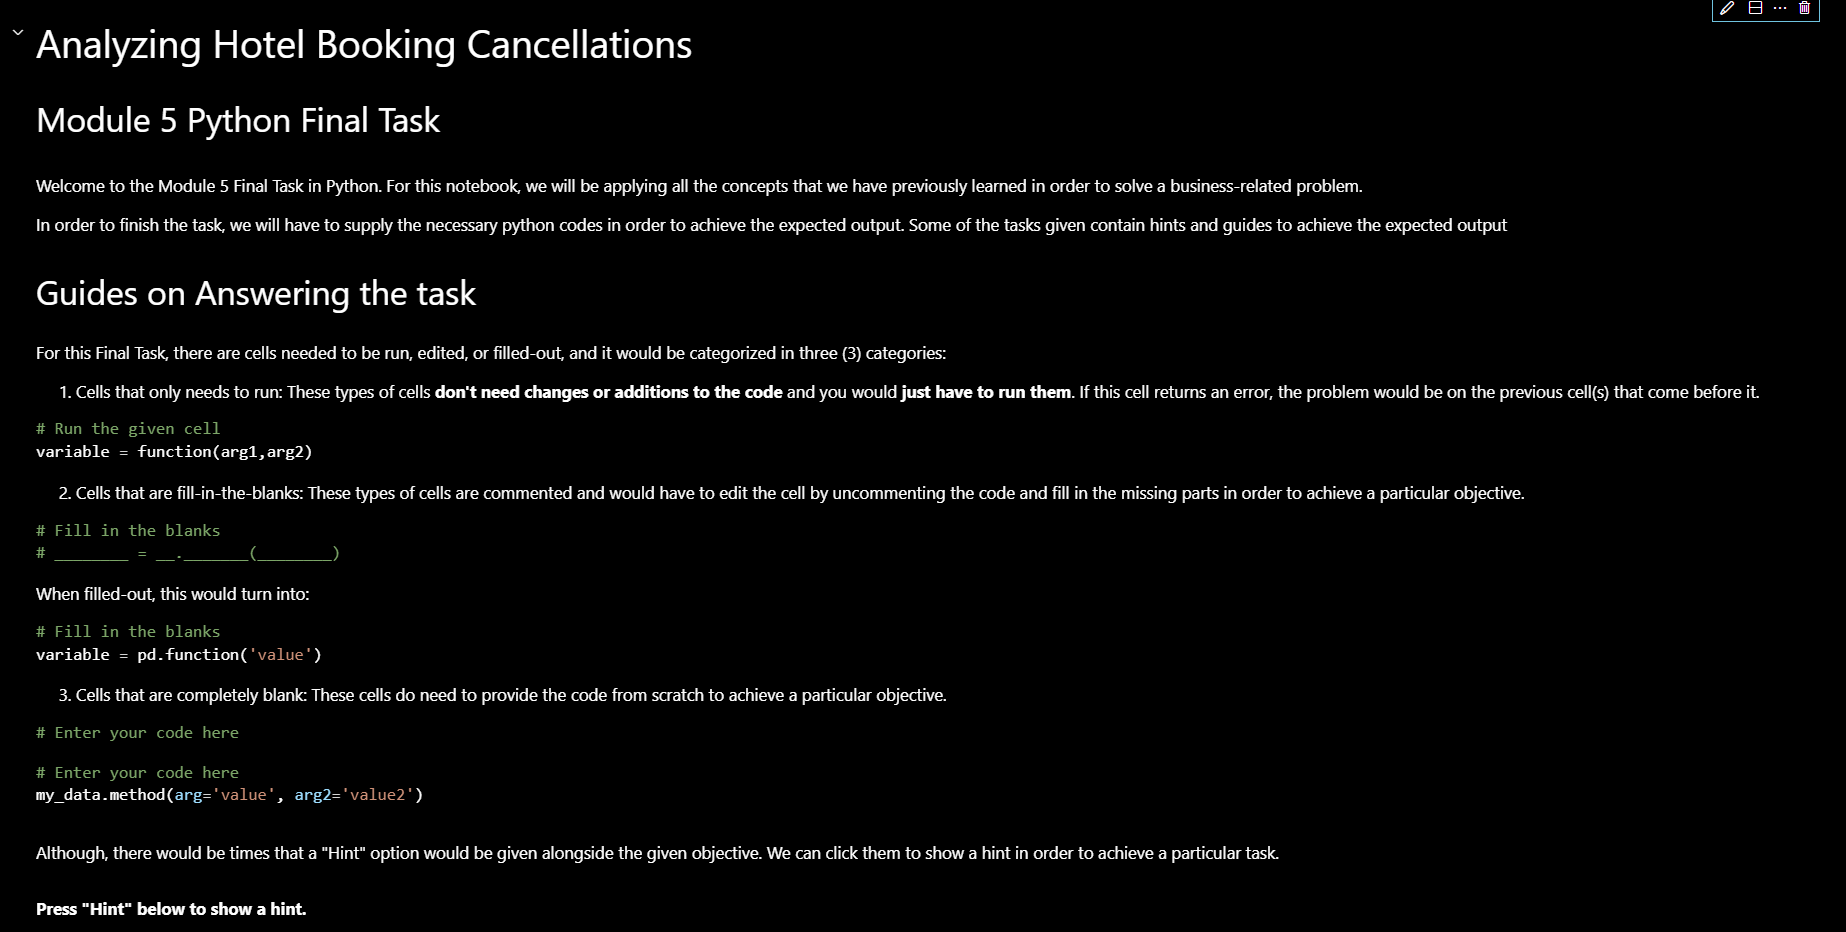
Metacritic Game Score Reviews
- Python
- Pandas
- Matplotlib
- Seaborn
- Hypothesis Testing
- Data Cleaning
- Exploratory Data Analysis
- Data Visualization
- Solo Project
This Project is a personal project since it is based on one of my interests, which is gaming. This also shows my learnings on Python. The goal of this project is to compare if the user's score is dependent to the critics score.
Note: Please do not edit the Jupyter notebook file.
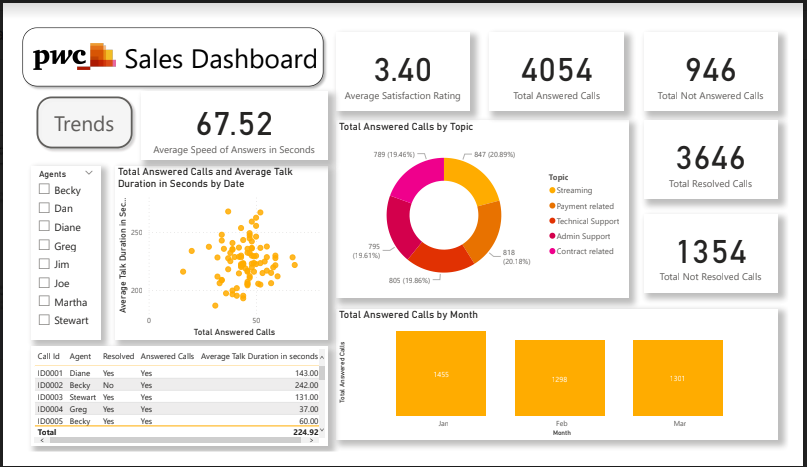
Telecommunication Call's Dashboard
- Power BI
- Forage
- Data Analysis
- KPI Metrics
- Virtual Internship Program
- Data Cleaning
- Exploratory Data Analysis
- Data Visualization
This Project is one of the Task From PWC Power BI in Data Analysis Virtual Internship Program in Forage. The program has task me to create a dashboard for the number of calls received by the agents and find important insights like the average call duration, resolved calls, etc.
Check it out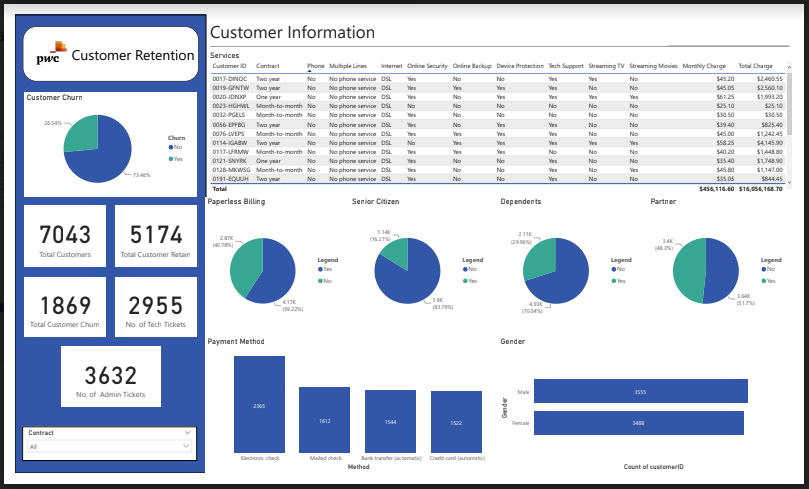
Customer Churn and Retention Dashboard
- Power BI
- Forage
- Data Analysis
- KPI Metrics
- Virtual Internship Program
- Data Cleaning
- Exploratory Data Analysis
- Data Visualization
This Project is one of the Task From PWC Power BI in Data Analysis Virtual Internship Program in Forage. The program has task me to create a dashboard for the customer retention and churn and find important insights like the the services the customer sign-up, customer demographic and Customer Account Information.
Check it out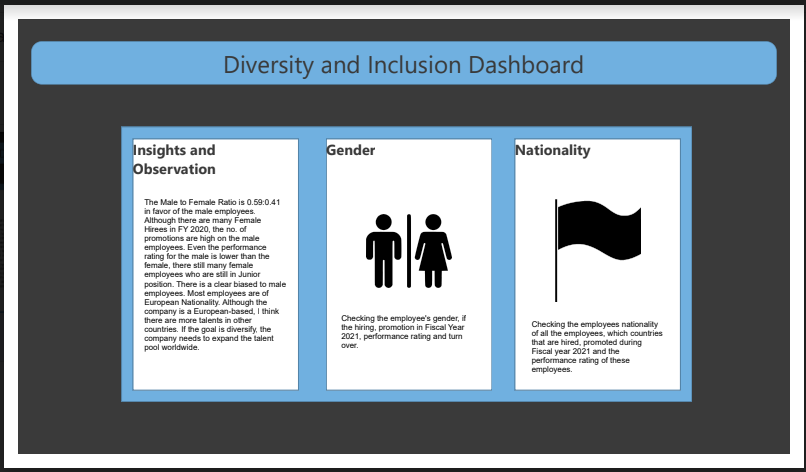
Diversity and Inclusion Dashboard
- Power BI
- Forage
- Data Analysis
- KPI Metrics
- Virtual Internship Program
- Data Cleaning
- Exploratory Data Analysis
- Data Visualization
This Project is one of the Task From PWC Power BI in Data Analysis Virtual Internship Program in Forage. The program has task me to create a dashboard for how the employee's gender and nationality affects the hirees, job position, turnover, performance metrics.
Check it out